探索
編輯
影片
應用
定價
討論區
登入
登入
首頁
探索
畫廊
膠囊廣場
編輯
影片
應用
定價
討論區
主題
淺色
深色
跟隨系統
語言
Y
Yang
追蹤
追蹤
1
作品
0
讚
0
粉絲
0
追蹤中
加入於 2026
作品
1
專輯
0
最新
熱門
檢視
Y
Yang
Y
Yang
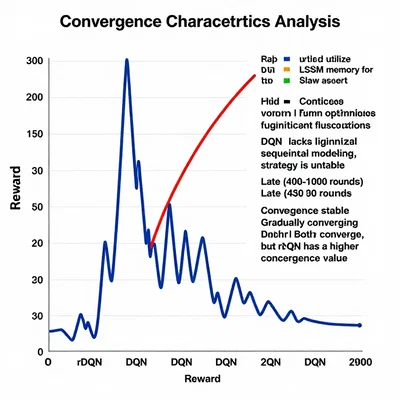
Help me generate an image: This is it: Draw a model training convergence graph based on the trend described in the following text. The graph should show some fluctuations even after convergence, with the initial gap between the two not being very large. The metric is "Reward". Additionally, please place the color and name identifiers of the curves in the upper right corner of the image. Convergence Characteristics Analysis: | Phase | **rDQN** | **DQN** | Explanation | |----------------|---------------|---------------|-----------------------------------------------------------------------------| | Early (0-100 rounds) | Rapid ascent | Slow ascent | rDQN utilizes LSTM memory for quick learning | | Mid (100-400 rounds) | Continuous optimization | Significant fluctuations | DQN lacks sequential modeling, strategy is unstable | | Late (400-1000 rounds) | Convergence stable | Gradually converging | Both converge, but rDQN has a higher convergence value | rDQN basically converges around the 300th round, DQN needs about 400 rounds. After convergence, rDQN stabilizes around 200, while DQN stabilizes around 150. The convergence value of rDQN is approximately 33% higher than that of DQN, indicating that the LSTM module significantly improves strategy quality.